
Europe has many promising startups, strong research institutions and established industries that can help new technologies reach the market. Its challenge is to turn more of those companies into international businesses. This article follows that journey: where Europe’s startups are concentrated, how their focus and financing compare globally, and how investors and local networks support their growth.
Financing changes along the way. Pre-seed money helps test an idea; seed funding supports a product and first customers; Series A and later rounds finance expansion. In Europe, founders, angels and venture capital investors work alongside national and EU programmes. The appropriate mix depends on the company’s technology, revenue and stage of development.
The European startup landscape
A strong startup environment gives people a route from an idea to a business that can serve customers beyond its home market. That makes startups relevant to Europe’s wider economy: they can commercialise research, introduce new products and create future employers. The European Commission’s startup strategy puts this ambition explicitly on the political agenda.
“The Strategy will enable us to turn Europe’s wealth of creativity, research and ambition into thriving new companies, quality jobs and real-world impacts.”
Ekaterina Zaharieva, European Commissioner for Startups, Research and Innovation · 28 May 2025 [53]
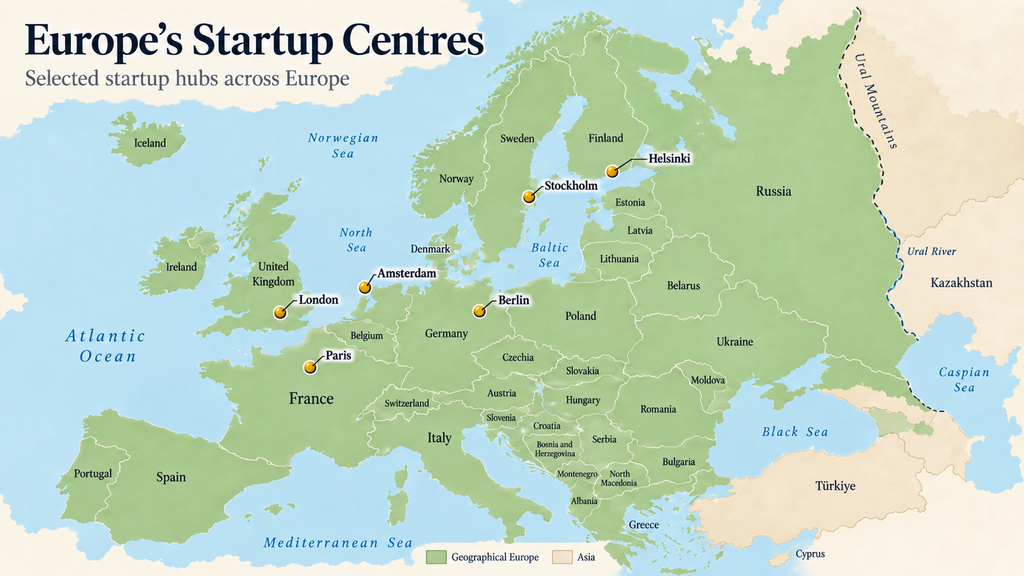
That ambition applies to a continent broader than the European Union. The UK, Switzerland and Norway belong in a European comparison, while EU-only statistics and programmes need to be identified separately. The country table follows Dealroom’s statistical Europe grouping; its treatment of transcontinental countries is explained in the methodology.
Startup density across European countries
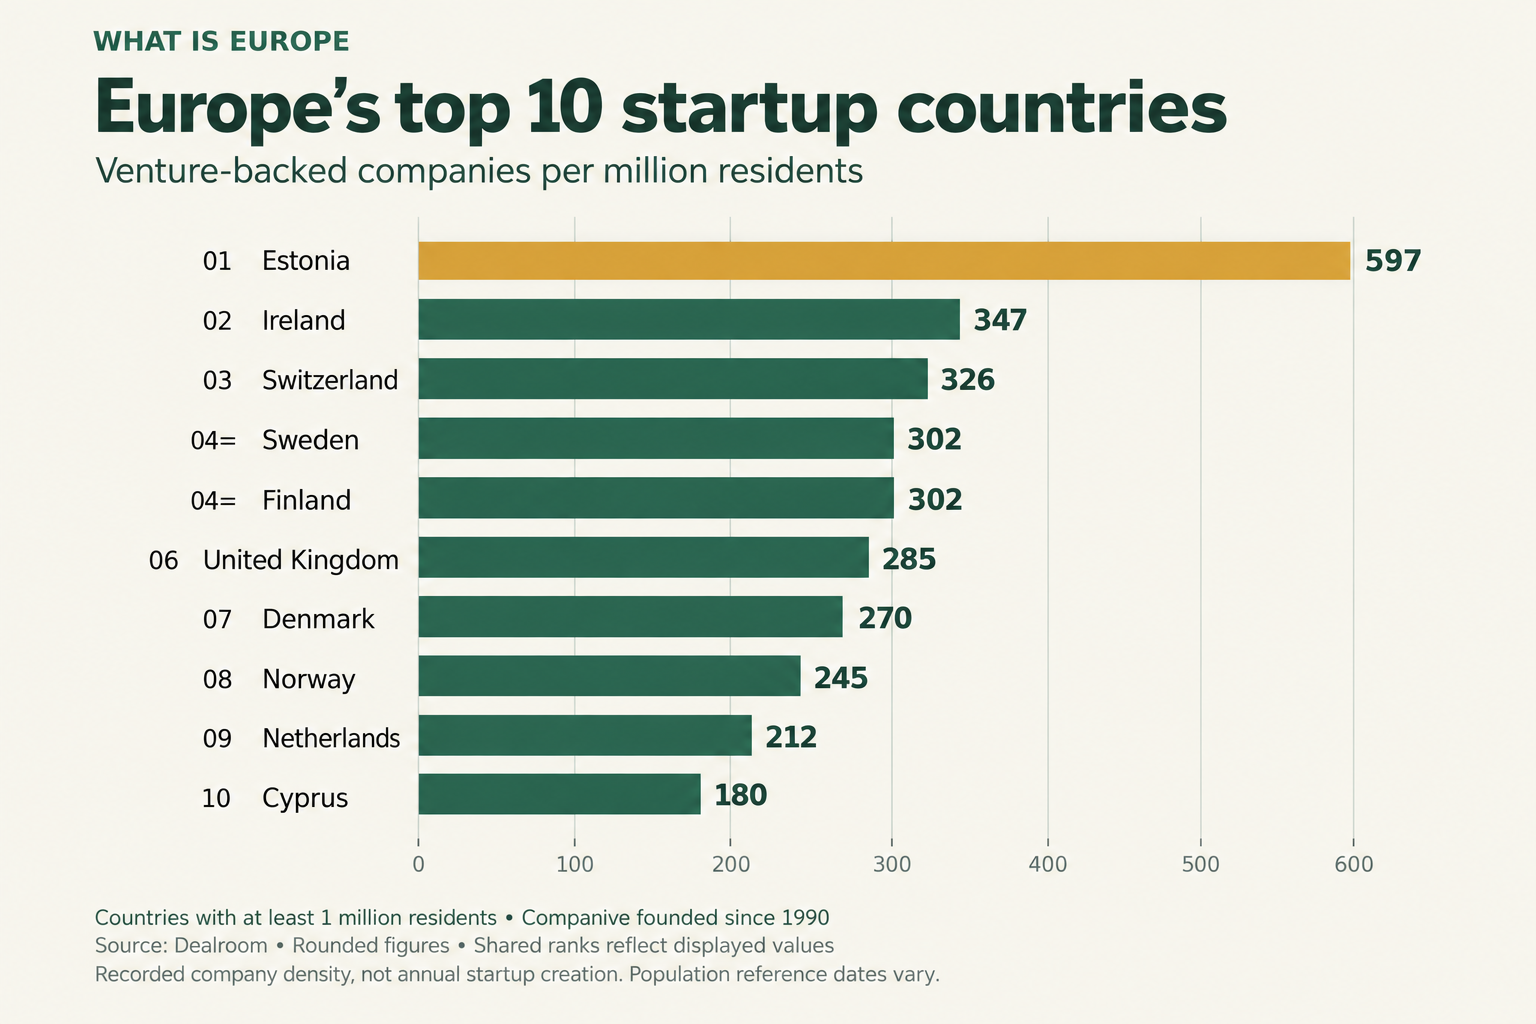
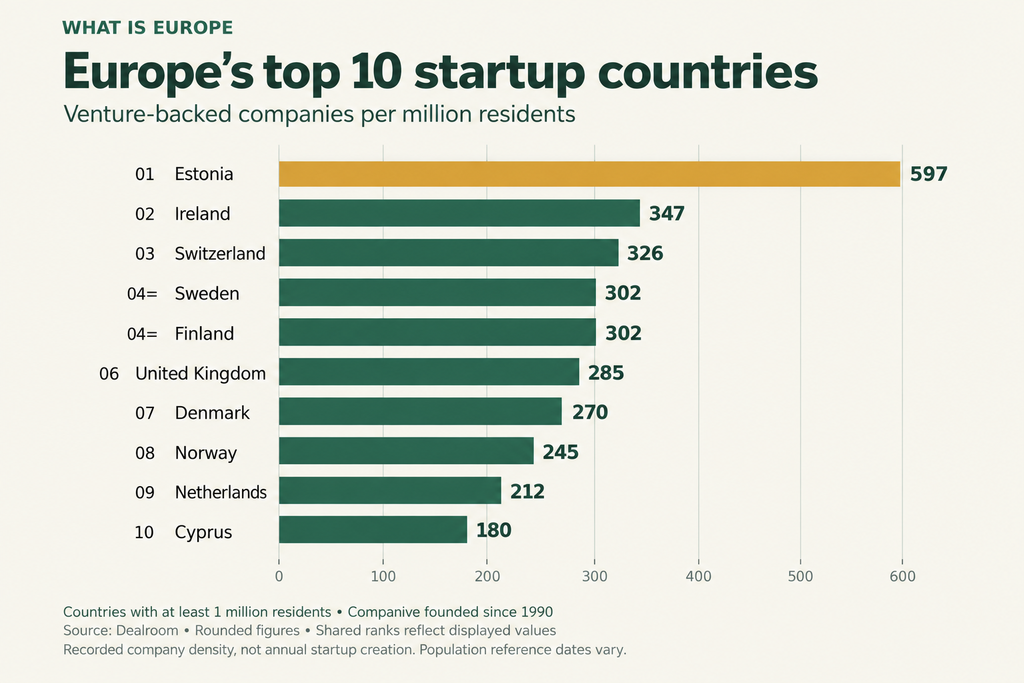
Large economies tend to have more companies in absolute terms. A comparison per inhabitant asks a different question: how concentrated is the recorded startup activity? Table 1 uses Dealroom’s cumulative population of venture-backed companies founded since 1990. It therefore includes older businesses and measures database density rather than annual startup creation. [1]
Table 1 Venture backed companies by country
| Country | Population M | Companies | Per million |
| Liechtenstein | 0.04 | 27 | 675 |
| Estonia | 1.4 | 836 | 597 |
| Iceland | 0.393 | 191 | 486 |
| Ireland | 5.4 | 1,874 | 347 |
| Luxembourg | 0.690959 | 238 | 344 |
| Switzerland | 9 | 2,931 | 326 |
| Sweden | 10.6 | 3,203 | 302 |
| Finland | 5.6 | 1,691 | 302 |
| United Kingdom | 69.2 | 19,700 | 285 |
| Denmark | 6 | 1,617 | 270 |
| Norway | 5.6 | 1,374 | 245 |
| Netherlands | 18 | 3,812 | 212 |
| Cyprus | 1.3 | 234 | 180 |
| Lithuania | 2.9 | 516 | 178 |
| Belgium | 11.9 | 1,828 | 154 |
| Latvia | 1.9 | 288 | 152 |
| Malta | 0.52 | 68 | 131 |
| France | 68.5 | 8,699 | 127 |
| Andorra | 0.082 | 10 | 122 |
| Austria | 9.2 | 987 | 107 |
| Germany | 83.5 | 8,478 | 102 |
| Spain | 48.8 | 4,352 | 89 |
| Portugal | 10.7 | 894 | 84 |
| Monaco | 0.039 | 3 | 77 |
| Slovenia | 2.1 | 157 | 75 |
| Czechia | 10.9 | 743 | 68 |
| Bulgaria | 6.4 | 419 | 65 |
| Hungary | 9.6 | 574 | 60 |
| Croatia | 3.9 | 195 | 50 |
| Italy | 59 | 2,665 | 45 |
| Poland | 36.6 | 1,627 | 44 |
| Slovakia | 5.4 | 195 | 36 |
| Greece | 10.4 | 333 | 32 |
| San Marino | 0.034 | 1 | 29 |
| Romania | 19.1 | 464 | 24 |
| Georgia | 3.7 | 60 | 16 |
| Serbia | 6.6 | 105 | 16 |
| North Macedonia | 1.8 | 28 | 16 |
| Ukraine | 37.9 | 579 | 15 |
| Moldova | 2.4 | 28 | 12 |
| Montenegro | 0.624 | 7 | 11 |
| Russia | 143.5 | 1,474 | 10 |
| Belarus | 9.1 | 74 | 8 |
| Albania | 2.7 | 18 | 7 |
| Bosnia and Herzegovina | 3.2 | 16 | 5 |
| Kosovo | 1.5 | 6 | 4 |
Sources: Dealroom [1], retrieved 30 September 2026; Luxembourg population: STATEC [2]. Per million = company count ÷ population in millions. Counts and most population figures are rounded, with mixed reference dates; close positions are indicative.
Several smaller European countries have high recorded densities. Estonia and Iceland stand out, while Sweden and Finland have similar displayed ratios. The UK combines a large company population with a relatively high density. Tiny populations, such as Liechtenstein’s, can produce high ratios from small company counts; the ranking should therefore be read alongside the absolute numbers.
Definitions also change the result. The Commission’s broader Startup and Scaleup Scoreboard identifies more companies than the venture-backed measure. Its Denmark benchmark is shown separately in the methodology. Registration, founding location and current headquarters may also differ, so a high company count alone cannot establish how much economic activity takes place locally. [1, 3]
These figures show that Europe has a substantial entrepreneurial base. The next question is whether those companies have access to the capital and markets needed to grow, and how Europe compares with other startup economies.
Europe in the global startup economy
Europe’s position depends on both the amount of capital available and the technologies being developed. The USA attracts much more venture capital, China combines AI with industrial priorities, and the rest of the world contains a range of specialisations. Europe’s strengths in research and engineering sit within that global competition.
“As they grow, the limited availability of risk capital forces them to turn to foreign investors.”
Ursula von der Leyen, President of the European Commission · State of the Union address · 10 September 2025 [54]
Von der Leyen was referring to European startups in technologies such as quantum, AI and biotech. Her statement reflects a policy concern about financing and where growth takes place. International investors can also be valuable partners; the comparison below measures the financing gap without assuming that foreign investment automatically moves a company abroad.
The scale of investment
Dealroom’s 2024 report provides a consistent four-way comparison. Europe received 16% of global venture investment, compared with 57% for the USA and 12% for China. The remaining approximately 15% went to the rest of the world. [4]
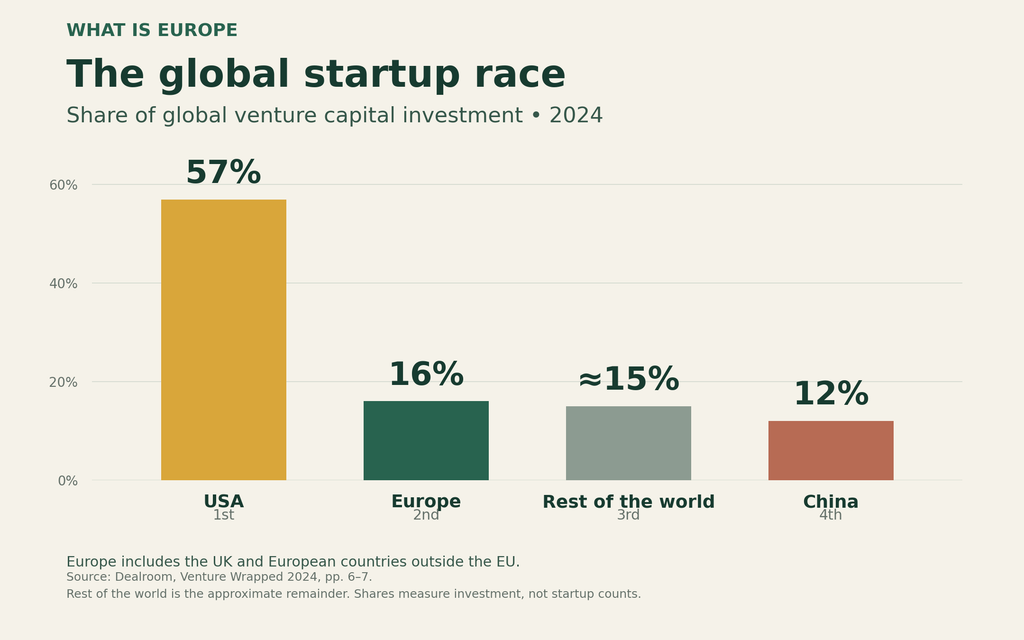
Table 2 Global venture capital shares in 2024
| Region | Global VC share 2024 |
| Europe | 16% |
| United States | 57% |
| China | 12% |
| Rest of world | Approximately 15% |
| World | 100% |
Source: Dealroom Venture Wrapped 2024, pages 6–7 [4]. Rest of world is the residual after Europe, USA and China and inherits rounding. These shares are not converted into dollar estimates.
The newer 2025 figures reinforce the financing gap: Dealroom records $282.0 billion invested in the USA and $63.8 billion in Europe, against $444.1 billion globally. The American total was approximately 4.4 times Europe’s. [5–7]
Table 3 European and American investment in 2025
| Region | VC investment 2025 USD B | Share |
| Europe | 63.8 | 14.4% |
| United States | 282.0 | 63.5% |
| World | 444.1 | 100% |
Sources: Dealroom [5–7]. Amounts in US dollars; B = billion. Shares are calculated from the displayed global total. This is a Europe–USA comparison, not a complete four-region breakdown for 2025.
Europe
Europe’s research-intensive companies work in areas including energy, biotechnology, robotics, semiconductors and quantum computing. Deep tech, meaning products based on substantial scientific or engineering advances, attracted 32% of European venture capital in 2025 according to Dealroom. The UK, France and Germany attracted the largest amounts. Defence startups raised a record $1.8 billion in the report’s narrower defence category. [42]
These companies often need laboratories, specialist employees, industrial testing and initial customers before they can scale. Funding remains important after technical progress: only 54% of financing for European deep tech rounds above $15 million came from within Europe, compared with 80% domestic funding in the USA. The local networks examined later in this article address the technical and commercial side of that same growth challenge. [42]
United States
AI dominates recent American investment. NVCA reports that AI accounted for 65.4% of US venture deal value in 2025, with strong concentration in infrastructure and foundation models alongside continuing investment in life sciences. Large rounds heavily influence annual totals, so this percentage is not the share of American startups developing AI. [43]
Using a single dataset for AI, OECD finds that US-based firms received about 75% of global AI venture investment in 2025. EU27 firms received 6%, UK firms 5% and Chinese firms 5%. EU27 and UK together do not cover all Europe. AI overlaps with health, finance and other sectors, so these categories cannot simply be added together. [44]
China
China combines AI investment with physical and industrial technologies. OECD identifies non-AI investment in energy, raw materials, utilities, mobility and autonomous vehicles as part of the explanation for AI’s flatter share of Chinese venture investment. [44]
China’s stated priorities for 2026 include integrated circuits, aviation and aerospace, biomedicine and the low-altitude economy, including drone-related activities. Future priorities include energy, quantum technology, embodied AI, brain-computer interfaces and 6G. Its AI Plus initiative promotes commercial applications across industries. These are government priorities, distinct from measured private investment shares. [45]
Rest of the world
The rest of the world remains a single comparison group. Its internal differences are useful context: some markets concentrate on financial and digital services, while others support research-intensive technologies. Table 4 gives selected examples rather than an exhaustive global ranking.
Table 4 Selected areas of focus within the rest of the world
| Market or region | Selected areas of focus and evidence |
| India | Fintech, consumer technology and software as a service. Bain and IVCA’s 2026 report describes renewed fintech investment, larger software transactions and growth in AI applications, using 2025 data. [46] |
| Latin America | Fintech and e-commerce attracted the most venture dollars in LAVCA’s report covering 2024. Its subsequent report covering 2025 finds that VC-backed AI startups mainly focus on enterprise applications. [47] |
| Africa | Fintech leads early-stage investment across MAGNiTT’s 2021 to September 2025 sample. AVCA finds that climate-related ventures received 40% of African venture deal value in 2025; that figure includes both equity and debt. [48, 49] |
| Middle East and North Africa | Fintech, enterprise software and AI are prominent investment areas. Fintech represented 26% of the number of venture deals in 2025, according to MAGNiTT. Saudi Arabia and the UAE are major funding centres. [49] |
| Israel | Cybersecurity is a marked specialisation. OECD also finds that more than half of venture investment went to AI firms in 2025. AI and cybersecurity categories can overlap. [44, 50] |
| Singapore | Public co-investment prioritises deep tech. Enterprise Singapore identifies examples in biotech, quantum and space technology; the 2026 expansion of Startup SG Equity also supports growth-stage deep tech companies. This is programme focus rather than an economy-wide sector ranking. [51] |
| Canada and Australia | Canadian 2025 reporting identifies information and communications technology and life sciences as important investment sectors. Australia’s 2025 recovery involved AI and large rounds, while later-stage deep tech and climate ventures continued to require public support. [52] |
Sources: [44, 46–52]. Periods and financing coverage differ as stated in the table. MENA and Africa overlap geographically; these examples are not mutually exclusive statistical totals.
Capital needs also vary with the product. Developing a medicine or a manufacturing technology can require substantial spending before revenue. Europe’s global position therefore leads to a practical question: how can financing support the whole journey from an early idea to an established business?
Financing the journey from idea to growth
Startups need different forms of finance as uncertainty changes. An early company may still be testing whether the technology works and whether customers will pay. A later company may already have a product and need money to enter new markets or increase production. Europe’s private investors and public programmes serve different parts of this journey.
“We just need to provide them with the right financing, at the right time”
Nadia Calviño, President of the European Investment Bank Group · Annual EU Budget Conference · 21 May 2025 · Excerpt [55]
Calviño was discussing Europe’s startups, researchers and entrepreneurs. The financing instruments below turn that principle into distinct routes: grants for eligible projects, investment in company ownership, and lending when repayment is feasible.
The financing phases
Founders’ resources, early customer revenue, grants and angels can help test an idea. Seed investors and venture capital can then support product development and expansion. Debt becomes more suitable as revenue, professional backing or repayment capacity develops. Some companies grow from customer revenue without raising VC; research-intensive businesses may need grants and equity across several phases. [9–13]
Table 5 Financing phases and typical routes
| Phase | What is being financed | Typical routes |
| Pre-seed | Idea, feasibility and prototype | Founders, grants, angels |
| Seed | Product testing and first customers | Angels, seed funds, grants |
| Series A | A repeatable business and expansion | VC equity, strategic investors |
| Series B and later | Larger markets and operations | Larger VC or growth funds; venture debt can complement equity |
Sources: [9–13]. Phases describe a typical financing path, not fixed company ages or funding amounts. There is no single financing form that dominates every European company or phase.
Where investment funds get their capital
Venture capital managers raise money from limited partners, including pension funds, insurers, foundations, family offices, companies and public institutions. These commitments give funds the capacity to invest in startups. They differ from the money a startup actually receives.
Table 6 Investors behind venture capital funds
| Indicator 2015 to 2025 | EU | USA |
| Public LP participation | About one third | About 4% |
| Pension funds | 10% of participation | Leading investor group |
| Foundations | Smaller role | 25% of participation |
| Pension share when commitments estimated | 19% | Not separately stated here |
| Foundation share when commitments estimated | Not separately stated here | 35% |
Source: ECB Chart A and notes [8]. Participation measures the number of investments; the last two rows use estimated commitment sizes. Coverage is EU and USA, not all Europe.
The ECB argues that a broader institutional investor base could strengthen EU scaleup financing. This links the global investment gap to the structure of the financing system: larger long-term commitments can support funds able to back bigger rounds. [8]
Government and EU support
An innovation grant pays for eligible activities without buying shares. A loan must be repaid; a guarantee shares a lender’s risk. Public equity takes an ownership interest, while investment in a venture fund reaches startups indirectly. These mechanisms can complement private investment by reducing early uncertainty or increasing available capital. [10–16]
Table 7 Examples of public financing routes
| Level and provider | Instrument | Role |
| EU EIC Accelerator [10] | Grant and equity or quasi-equity | Develop and scale selected high-risk innovations |
| EU EIF and InvestEU [11, 12] | Fund investments and lender guarantees | Expand finance through intermediaries |
| EU EIB [13] | Venture debt | Complement professional equity financing |
| Sweden Vinnova [14] | Innovation grants | Validate customer needs and a business proposition |
| Sweden Almi and Almi Invest [15, 16] | Loans and equity respectively | Support development and early growth |
| Germany KfW [17] | StartGeld loans through finance partners | Finance new and young businesses |
| France Bpifrance [18] | Innovation support and fund investments | Support innovation and strengthen risk capital |
| UK British Business Bank [19] | Fund commitments and co-investment | Strengthen venture and growth finance |
Sources: [10–19]. Examples identify channels rather than rank government spending. National schemes may support businesses outside a venture-capital definition of a startup.
At EU level, the EIC Accelerator offers grants below €2.5 million and investment components of €1–10 million for selected innovations, subject to its conditions. Blended finance combines a grant with equity or quasi-equity. UK applicants can receive grant-only Accelerator support, illustrating why access differs across Europe. [10]
The EIF strengthens equity and lending through intermediaries under InvestEU. The EIB also offers venture debt for eligible innovative companies with professional equity backing. These instruments expand the financing system as well as support individual companies. An EIF commitment to a fund and that fund’s subsequent startup investment must not be counted as two independent amounts received by the company. [11–13]
Sweden illustrates the different routes. Vinnova’s Innovativa Startups 2026 call advertises grants up to SEK 500,000 to test customer needs, the business idea and willingness to pay, with applications scheduled to open on 12 October 2026. Almi provides repayable loans and Almi Invest makes equity investments. An award can support progress, but it does not establish lasting commercial success. [14–16]
Financing is most useful when a company can also find the people, testing environments and customers needed to advance. That is where European startup centres connect national and EU opportunities with practical local support.
Where capital research and industry meet
National averages conceal local concentrations of talent and investment. Startup centres bring founders close to universities, specialist employees, investors and potential customers. Established businesses can offer testing opportunities and market knowledge; successful startups can later provide experienced staff and capital for new ventures.
“we need to invest in pioneering companies and ensure they have all the resources they need to thrive in the capital.”
Sadiq Khan, Mayor of London · Frontier Innovation Fellowship announcement · 10 June 2025 · Excerpt [56]
Khan was discussing support for frontier innovation in London. The wider point is visible across the European centres below: finance works alongside research, industrial expertise and commercial connections.
Table 8 Venture capital across European metropolitan regions
| Metro region | VC investment 2025 USD B |
| London | 18.5 |
| Paris | 6.4 |
| Munich | 3.1 |
| Stockholm | 2.9 |
| Berlin and Brandenburg | 2.8 |
| Cambridge UK | 2.3 |
| Amsterdam | 1.7 |
| Copenhagen | 1.3 |
| Helsinki | 1.3 |
| Barcelona | 1.3 |
Source: Dealroom Europe guide, full-year 2025 [5]. Metropolitan regions follow the source’s definitions. Amounts in US dollars; rounded ties should not be read as exact equality.
Financing opportunities across six centres
Table 9 connects financing phases with selected options in London, Paris, Berlin, Amsterdam, Helsinki and Stockholm. Many funds invest beyond their home city, while public eligibility may depend on the country or region. Grants usually support a defined innovation project; equity investors assess the company, team and growth opportunity. [20–29]
Table 9 Selected grants and investment options by phase
| Startup centre | Pre-seed | Seed | Series A | Growth B and later |
| London [20–22] | E: Seedcamp | E: Seedcamp; Index Ventures | E: Index Ventures G + E: Innovate UK Investor Partnerships* | E: Index Ventures; Future Fund: Breakthrough for eligible R&D companies |
| Paris [23, 24] | G: Bourse French Tech E: Partech Seed | E: Bpifrance F3A; Partech Seed | E: Bpifrance FAN; Partech Venture | E: Bpifrance Large Venture; Partech Growth |
| Berlin [25, 26] | G: GründungsBONUS Plus E: IBB Ventures B# for deeptech | E: IBB Ventures; HV Capital | E: IBB Ventures; HV Capital G: Pro FIT eligible R&D projects | E: HV Capital; IBB Ventures follow-on rounds in its portfolio |
| Amsterdam [27] | E: Antler | E: Antler; ROM InWest for eligible regional companies | E: Antler later-stage capital; ROM InWest where suitable | E: Invest-NL for eligible innovation and transition companies |
| Helsinki [28] | G: Business Finland Sprint E: Lifeline Ventures | G: Sprint or Business Finland research grants E: Lifeline; Inventure | G: Business Finland research grants E: Inventure | E: Tesi directly or through funds |
| Stockholm [29] | G: Vinnova Innovativa Startups E: Antler | G: Vinnova subject to call E: Almi Invest; Northzone | E: Northzone; Almi Invest portfolio follow-on rounds | E: Northzone |
G = grant; E = equity. Sources: [20–29]. Phase placement is indicative, based on programme objectives and investor strategies. Examples are not confirmation of an open application window.
Innovate UK Investor Partnerships combines R&D grants with aligned private investment and can support more than one company phase. Grants shown in a column may also be relevant at other stages when the project qualifies. EU routes such as EIC Accelerator, EIF/InvestEU and EIB venture debt apply across eligible locations; they are not universally available at a particular Series A or B round. Loans, guarantees and tax incentives are outside this grant-and-equity matrix. [10–13, 21]
London
London connects finance and technology with life sciences and media. MedCity links biotech, medtech and pharmaceutical companies with research institutions, while London Life Sciences Week provides an investor showcase for spinouts and early-stage businesses. London & Partners connects startups with corporates and investors. These routes complement the Seedcamp, Index Ventures and public-financing examples in Table 9 by providing scientific and commercial contacts. [20–22, 30, 31]
Paris region
The Paris region combines AI, health, mobility and aerospace with public and private investment. STATION F hosts corporate programmes, including one with Sanofi in healthtech. Choose Paris Region scouts startups for corporate partners and organises meetings and experimentation; NextMove supports collaborative mobility and automotive R&D. These mechanisms connect the Bpifrance and Partech financing routes with industry problems, technical partners and potential buyers. [23, 24, 32–34]
Berlin Brandenburg
Berlin and Brandenburg link digital industries, health, photonics, microsystems and energy. Berlin Partner connects businesses, universities and research institutions; Adlershof provides specialist centres and shared environments; OpTecBB offers a network in optical technologies. IBB Ventures, HV Capital and eligible regional grants provide financing routes alongside this technical support. Access to equipment and expertise matters particularly when a product cannot be validated using software alone. [25, 26, 35, 36]
Amsterdam region
Amsterdam’s regional networks work on energy and industrial transition, circular materials, technology and AI. The Amsterdam Economic Board links companies, public bodies and research. Its collaboration with the city, ROM InWest, AMS Institute and Rabobank has addressed cooperation between large organisations and startups, including procurement. Alongside Antler, ROM InWest and Invest-NL financing, these connections address who can test, buy and deploy a new solution. [27, 37, 38]
Helsinki Espoo
Helsinki and Espoo combine deep tech, digital technology, health and sustainable urban solutions. Maria 01 brings startups, investors and corporate partners together. Aalto Startup Center and A Grid support research-driven entrepreneurship in Espoo, within an ecosystem including spinouts from VTT and Nokia. Testbed Helsinki enables development with real users in schools, health services and the built environment. Business Finland, Lifeline, Inventure and Tesi offer financing routes alongside these research and validation opportunities. [28, 39, 40]
Stockholm region
Stockholm connects telecoms, semiconductors, deep tech, health and energy. Kista Science City provides links to research and testbeds operated by organisations including KTH and RISE. Sting combines business development with investor access; Ignite matches corporate needs with startups; THINGS participates in energy-related collaboration. Vinnova, Antler, Almi Invest and Northzone illustrate financing options that can complement those technical and customer connections. [29, 41]
These functions evolve with the company. Research and co-founder contacts can help at pre-seed; testing and pilots can support seed development; reference customers and commercial partners can strengthen expansion; international networks can help later growth. This is a practical interpretation of the examples. A network membership, introduction or pilot is not the same as a completed commercial contract, and the evidence does not measure what proportion of all startups benefit.
Helping European companies grow internationally
The article’s comparisons point to a connected challenge. Europe has a substantial base of venture-backed companies, research-intensive technologies and local networks. It also receives far less venture capital than the USA. More growth finance can help, but companies still need products customers want and routes to larger markets.
Small home markets can encourage international ambition early. They also make expansion necessary sooner, bringing differences in language, regulation, purchasing practices and finance. Better access to Europe’s connected markets and to long-term investment would help companies build on their local strengths.
Startup density is one sign of entrepreneurial activity. The results that eventually matter are useful innovation, employment, sales and lasting business performance. Europe’s opportunity is to connect its research and industrial strengths with the finance and customers that allow more promising companies to become international businesses.
Sources and methodology
The country comparison uses Dealroom’s cumulative VC-backed population founded since 1990. It is not a census of all startups or a ranking of annual company creation. Density is company count divided by population in millions. Counts and most population figures are rounded and have mixed reference dates. Luxembourg uses STATEC’s 1 January 2026 population of 690,959 instead of the erroneous 100,000 shown in Dealroom. A harmonised, common-year population series would be needed for a more precise ranking. [1, 2]
Country coverage follows Dealroom’s Europe grouping, excluding dependent territories. It includes Russia and Georgia as whole-country observations and includes Cyprus; Türkiye, Armenia, Azerbaijan and Kazakhstan are outside that source grouping. This is a statistical classification, not a geographical boundary claim. Regional totals retain each source’s Europe aggregate rather than being calculated from the country table. EU-only evidence is labelled separately. [1, 4, 5]
Table 10 How a broader startup definition changes the count
| Observation | Startup count | Per million |
| Denmark ESSS benchmark 2025 | 4,321 | 722.9 |
| EU ESSS benchmark 2025 | 225,988 | 501.9 |
| Denmark Dealroom current snapshot | 1,617 | 270 |
Sources: European Commission ESSS Denmark report [3] and Dealroom [1]. The broader ESSS measure and venture-backed observation cover different company populations and periods; they are not merged.
A company’s legal registration, founding location and current headquarters may differ. Estonia’s remote incorporation model illustrates that distinction; the article does not attribute its high density to foreign registrations. Annual venture investment, fundraising by investment funds and enterprise value are separate quantities.
Country data were retrieved on 30 September 2026. Financing, sector and network examples and quotations were reviewed on 1 October 2026. Annual comparisons use closed years and exclude annualised 2026 projections. Funding amounts are in US dollars unless stated otherwise. The NVCA sector share uses a different dataset from Dealroom’s regional totals. Sector categories can overlap, and the rest-of-world examples retain their stated dates and financing coverage.
Programme and investor examples describe potential routes, not guaranteed eligibility or open calls. Phase mappings are indicative. The metropolitan examples include wider regions: Aalto’s campus is in Espoo; Berlin includes Brandenburg; Paris and Amsterdam extend beyond municipal boundaries. Quotations document named leaders’ stated priorities and do not establish consensus or independently prove the statistical findings.
[1] Dealroom Country startup ecosystem profiles
[2] STATEC Luxembourg population on 1 January 2026
[3] European Commission ESSS Report for Denmark 2026 pages 3 and 4
[4] Dealroom Venture Wrapped 2024 pages 6 and 7
[6] Dealroom United States guide
[7] Dealroom Global venture capital guide
[8] ECB Exploring the investor landscape for venture capital Chart A and notes
[9] British Business Bank Guide to equity funding stages
[10] European Innovation Council EIC Accelerator
[11] EIF InvestEU Equity products
[12] EIF InvestEU Guarantee products
[13] European Investment Bank Venture debt
[14] Vinnova Innovativa Startups 2026
[15] Almi Loans and finance overview
[16] Almi Invest Investment criteria
[17] KfW Financing and support for founders
[18] Bpifrance Innovation finance
[19] British Business Bank Equity finance
[20] Seedcamp and Index Ventures investor strategies · Seedcamp
[21] Innovate UK Investor Partnerships
[22] British Business Bank Equity finance
[23] Bpifrance Bourse French Tech
[24] Partech investment strategies · F3A · FAN · Large Venture
[25] IBB Ventures investment approach · GründungsBONUS · Pro FIT
[26] HV Capital investment approach
[27] Antler Continental Europe · ROM InWest · Invest-NL
[28] Business Finland Sprint Grant · Research grants · Lifeline · Inventure stages · Tesi
[29] Northzone Seed to Growth strategy · Antler Nordics · Almi Invest
[30] London and Partners technology ecosystem
[31] London life sciences and MedCity connections
[32] STATION F and Sanofi healthtech programme
[33] Choose Paris Region corporate innovation programmes
[34] Choose Paris Region mobility and NextMove
[35] Berlin Partner cluster development
[36] Adlershof science and technology centres · OpTecBB
[37] Amsterdam Economic Board regional collaboration
[38] StartupAmsterdam corporate collaboration event March 2026
[39] Maria 01 startup investor and corporate ecosystem
[40] Testbed Helsinki product development environments · Aalto · Espoo spinouts
[41] Kista Science City ecosystem · Sting · Ignite · Energy Action
[42] Dealroom European Deep Tech Report 2026
[43] NVCA 2026 Yearbook and 2025 investment findings · Full yearbook
[44] OECD Venture capital investments in artificial intelligence through 2025
[45] China Government Work Report 2026 industry priorities · AI Plus initiative
[46] Bain and IVCA India Venture Capital Report 2026
[47] LAVCA Trends in Tech 2026 · LAVCA 2025 report covering 2024
[48] AVCA Venture Capital in Africa Report 2025
[49] MAGNiTT State of Venture Capital in MENA 2025 · Fintech 2025 · Early-stage comparison
[50] Startup Nation Central Cybersecurity Spotlight 2025
[51] Enterprise Singapore Startup SG Equity expansion 2026 · Annual report 2024 and 2025
[52] CVCA Canadian Venture Capital Year End 2025 · Australia startup funding 2025
[53] European Commission Startup and Scaleup Strategy announcement and Zaharieva quotation 28 May 2025
[54] Ursula von der Leyen State of the Union address 10 September 2025
[55] Nadia Calviño Annual EU Budget Conference speech 21 May 2025
[56] London and Partners Frontier Innovation Fellowship and Sadiq Khan quotation 10 June 2025
Leave a Reply