
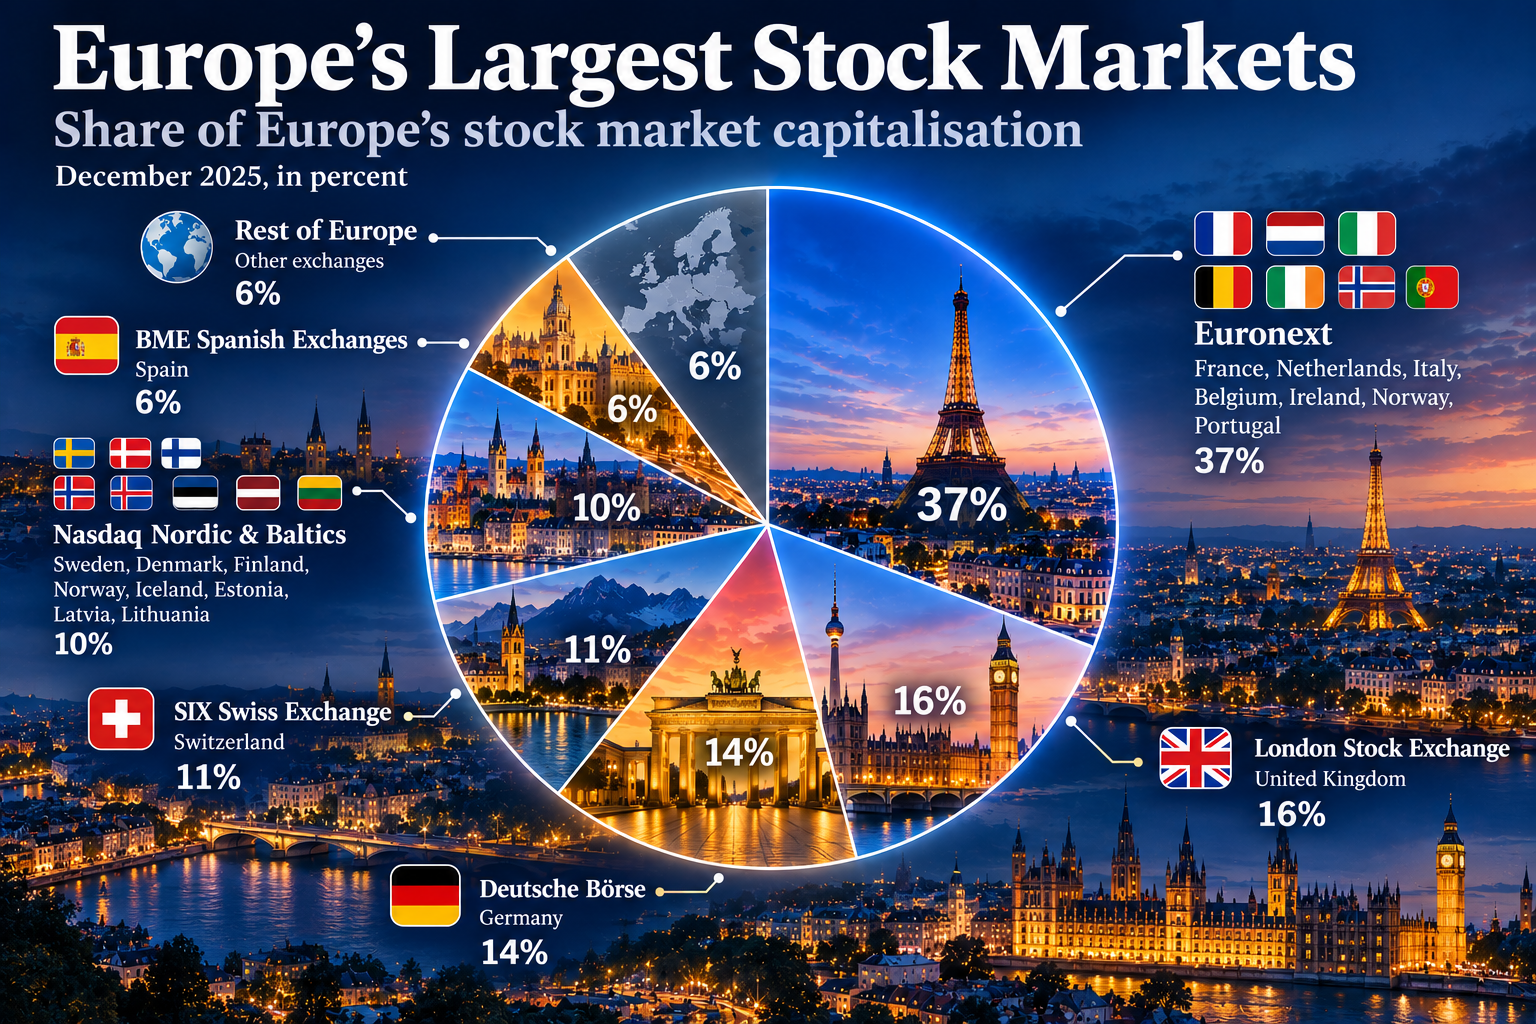
How Europe’s fragmented but increasingly connected equity markets compare with the United States, China and the rest of the world
Europe has some of the world’s largest and oldest stock markets. But there is no single “European stock exchange”.
Instead, Europe has a network of national and multinational markets. London and Switzerland remain outside the European Union. Euronext operates markets from Paris and Amsterdam to Milan, Oslo and Lisbon. Nasdaq operates several Nordic and Baltic exchanges.
These markets also have very different characters. Paris is home to many of Europe’s largest luxury, industrial and financial companies. Switzerland has major pharmaceutical, consumer and financial groups. Stockholm has an unusually developed equity market for a country of Sweden’s size, while Oslo has a particularly strong concentration of energy, shipping and seafood companies.
So which are Europe’s largest stock markets – and how large is Europe as a whole compared with the United States and China?
What does stock market size mean?
The most common measure is market capitalisation, or market cap.
Market capitalisation = share price × number of shares outstanding
If a company has one billion shares and each share is worth $50, its market capitalisation is $50 billion. The size of a stock market can then be estimated by adding together the market capitalisation of the companies included in that market.
There is an important complication: exchanges can list both domestic and foreign companies, and the same company can be traded on more than one venue. For the main exchange ranking below, we therefore use domestic market capitalisation as reported by the World Federation of Exchanges (WFE). The figures refer to December 2025 and are expressed in US dollars.
Europe’s largest stock exchanges
| Rank | Exchange or exchange group | Domestic market cap |
| 1 | Euronext | $8.10 tn |
| 2 | Deutsche Börse | $3.00 tn |
| 3 | SIX Swiss Exchange | $2.52 tn |
| 4 | Nasdaq Nordic & Baltics | $2.27 tn |
| 5 | BME Spanish Exchanges | $1.29 tn |
| 6 | Borsa Istanbul | $0.41 tn |
| 7 | Warsaw Stock Exchange | $0.32 tn |
| 8 | Vienna Stock Exchange | $0.21 tn |
| 9 | Athens Stock Exchange | $0.13 tn |
| 10 | Bucharest Stock Exchange | $0.068 tn |
| 11 | Budapest Stock Exchange | $0.063 tn |
| 12 | Prague Stock Exchange | $0.055 tn |
| 13 | Zagreb Stock Exchange | $0.038 tn |
Source: World Federation of Exchanges, December 2025 market statistics. London is discussed separately because comparable London Stock Exchange data are not included in this WFE table.
This ranking mixes individual exchanges with multinational exchange groups because that is how the comparable WFE statistics are reported. Euronext and Nasdaq Nordic & Baltics therefore need to be opened up to understand the individual markets inside them.
London: too important to leave out
London is one of Europe’s most important equity markets and a major international financial centre. It should not be interpreted as absent from Europe simply because it is absent from this particular WFE comparison.
The London Stock Exchange reports its market through its own statistics, separating UK and international issuers and distinguishing the Main Market from AIM. That structure makes London especially interesting, but it also means that inserting a single London figure into the WFE ranking would mix definitions. In this article, London is therefore treated separately rather than given a falsely precise rank.
Its character is unusually international, with broad exposure to finance, energy and mining as well as a separate growth-company ecosystem through AIM.
Inside Europe’s multinational exchanges
Euronext is the clearest example of how modern European exchanges cross national borders. Its individual markets remain recognisable, even though they are operated within one group.
| Euronext market | Aggregated market capitalisation |
| Paris | €3.111 tn |
| Amsterdam | €1.557 tn |
| Milan | €1.072 tn |
| Brussels | €0.413 tn |
| Oslo | €0.354 tn |
| Dublin | €0.106 tn |
| Lisbon | €0.093 tn |
Source: Euronext, December 2025. These are Euronext’s aggregated market-capitalisation figures and are not the same statistical definition as WFE domestic market capitalisation.
Paris is by far Euronext’s largest individual market, followed by Amsterdam and Milan.
Nasdaq has a similar structure in Northern Europe. Its December 2025 statistics give approximately:
| Nasdaq market | Listed market capitalisation |
| Stockholm | $1.33 tn |
| Copenhagen | $0.61 tn |
| Helsinki | $0.37 tn |
| Iceland | $0.020 tn |
| Baltic markets combined | $0.013 tn |
Source: Nasdaq Nordic market statistics, December 2025, converted to US dollars where necessary using end-of-year exchange rates. These figures describe the individual Nasdaq markets and should not be read as WFE domestic market capitalisation.
This makes Stockholm one of Europe’s largest individual equity markets, despite Sweden having a much smaller economy than Germany, France, Italy or the United Kingdom.
Europe’s stock markets are not all the same
| Market | Characteristic strengths |
| London | International listings; finance, energy and mining; separate AIM growth market. |
| Paris | Luxury and consumer brands alongside major industrial, financial, energy and healthcare companies. |
| Frankfurt / Xetra | Broad industrial and technology base, with major automotive and financial companies. |
| Switzerland | Healthcare and pharmaceuticals, global consumer companies and financial services. |
| Amsterdam | Semiconductors and technology alongside financials and international consumer companies. |
| Stockholm | Strong industrial base alongside finance and technology, with a developed growth-company ecosystem. |
| Copenhagen | Healthcare and life sciences, logistics and shipping, financials and industrial/green-technology companies. |
| Milan | Financials, industrial companies and major consumer and luxury businesses. |
| Oslo | Energy, shipping and seafood – sectors in which Euronext itself describes Oslo as a leading international market. |
These are market characteristics, not exclusive sector labels. Large exchanges are diversified, and their composition changes as company valuations and listings change.
These differences matter to both companies and investors. A company considering an initial public offering may care about whether a market already has investors and analysts familiar with its industry. An investor may care about the sector exposure that comes with a particular exchange or index.
Europe is not the European Union
For this article, Europe is not treated as synonymous with the European Union.
That distinction matters especially for capital markets. The United Kingdom and Switzerland host two of Europe’s most important financial centres. Norway’s Oslo market is part of Euronext, and Iceland is part of Nasdaq’s Nordic market structure. All are deeply connected to European capital markets even though none is an EU member.
The EU is nevertheless important because it provides a common regulatory and economic framework for most of Europe and is pursuing deeper capital-market integration. But the European equity market is broader than the EU itself.
How does Europe compare with the world?
For the regional comparison, it is more useful to treat Europe as an economic and capital-market region rather than stop at the EU’s political border.
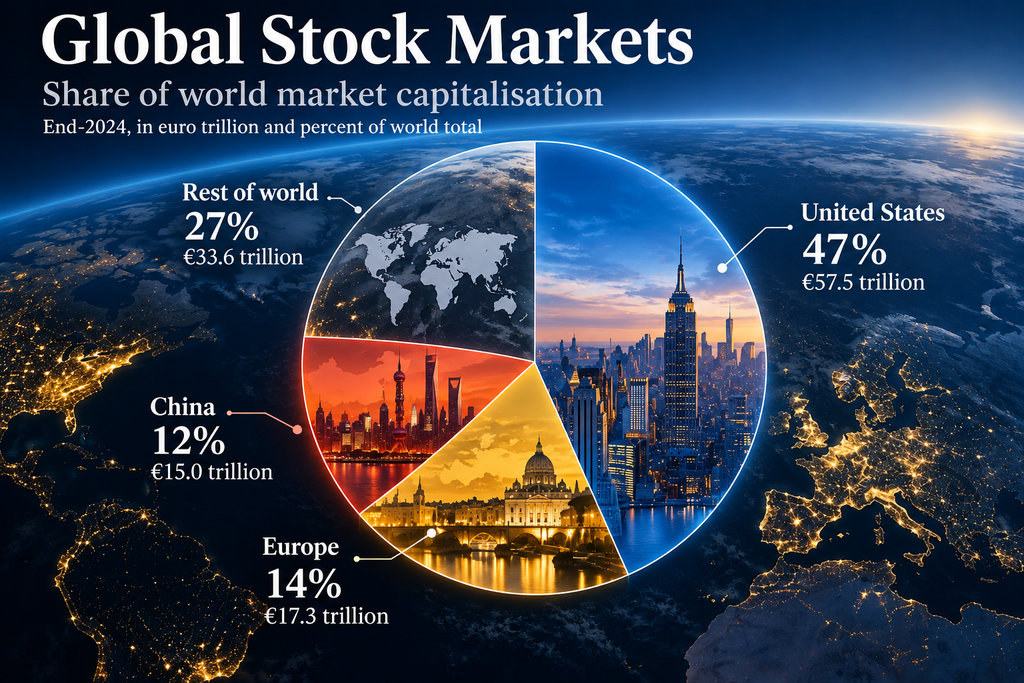
To keep the comparison measurable and avoid arbitrary splitting of transcontinental markets, the Europe estimate below includes the EU-27, the United Kingdom, Switzerland, Norway and Iceland. It does not attempt to allocate parts of Russian or Turkish listed companies geographically between Europe and Asia.
| Market | Market capitalisation, end-2024 | Share of world |
| United States | ~€57.5 tn | ~47% |
| Europe | ~€17.3 tn | ~14% |
| China | ~€15.0 tn | ~12% |
| Rest of world | ~€33.6 tn | ~27% |
| World | ~€123.4 tn | 100% |
Regional comparison uses end-2024 because this provides a more internally consistent cross-region reference set. Europe is approximately EU-27 + UK + Switzerland + Norway + Iceland. Values are rounded; the purpose is to show relative scale rather than false precision.
The result is different from an EU-only comparison. Europe as a whole represents roughly 14% of global listed equity market capitalisation – larger than mainland China on this measure, but still far below the United States.
The United States alone accounts for close to half of global listed equity value. Europe’s economy is much closer to the United States in scale than this stock-market comparison might suggest, which tells us something important about how companies are financed and owned.
Why is the US stock market so much larger?
Part of the explanation is the extraordinary market value of large US technology companies. But the difference is also structural.
European companies have historically relied more heavily on banks, private ownership and other forms of financing, while public equity markets play a larger role in the United States. European public markets also contain fewer companies with the enormous valuations reached by the largest US listed groups.
This helps explain an apparent paradox: Europe has many exchanges and thousands of listed companies, but its combined public equity market remains much smaller than the American market.
Why Europe has so many exchanges
Europe’s fragmented stock-market structure has historical roots. Modern capital markets developed around individual countries and financial centres: London, Paris, Amsterdam, Frankfurt, Milan, Zurich, Stockholm and many others built their own exchanges, regulations, currencies and investor communities.
European integration did not erase this structure. Instead, consolidation increasingly happened above the national markets.
Euronext now operates exchanges in several European countries. Nasdaq operates markets across the Nordic and Baltic region. SIX operates the Swiss exchange and owns Spain’s BME.
The result is a distinctly European structure: recognisable national markets increasingly connected through multinational exchange groups, common regulation, cross-border investment and – across much of the continent – the European Union’s single-market framework.
Stock market size is not the same as GDP
A large stock market does not necessarily mean that a country has an equally large economy.
GDP measures the value of goods and services produced during a period of time, usually one year. Market capitalisation measures the market value of listed companies at a particular point in time. They are fundamentally different measures.
A company can operate factories, shops and offices around the world while being listed primarily in one market. Its market value can therefore contribute to that market’s statistics even though much of its business takes place elsewhere.
Ownership structures also matter. If many companies remain privately owned, state-owned or financed mainly through banks, a country can have a large economy but a relatively small public stock market. The reverse is also possible.
Switzerland and Sweden are good examples of relatively small economies supporting substantial listed equity markets.
What does this tell us about Europe?
Europe does not lack stock markets. It has many of them.
It has major financial centres, thousands of listed companies and markets with distinctive industrial strengths. London, Paris, Frankfurt, Zurich, Amsterdam, Stockholm, Copenhagen, Milan and Oslo occupy different positions in the European financial landscape.
What Europe lacks compared with the United States is the same scale in one highly integrated public-equity ecosystem and the same concentration of extremely valuable listed companies.
That distinction matters. Measured by GDP, Europe remains one of the world’s largest economic regions. Measured by public equity market capitalisation, the gap with the United States is much larger.
Europe’s exchanges therefore tell us something that GDP alone does not: not just how large European economies are, but how European companies are owned, financed and connected to capital markets.
And the structure is still changing. National markets remain visible, while exchange ownership, regulation and investment increasingly cross borders. In that sense, Europe’s stock-market map is both fragmented and increasingly integrated.
Sources and methodology
World Federation of Exchanges (WFE): December 2025 market statistics: domestic market capitalisation and exchange-level data. https://focus.world-exchanges.org/issue/february-2026/market-statistics
Euronext: December 2025 monthly statistics and individual-market aggregated market capitalisation. https://www.euronext.com/en/media/15109/download
Nasdaq Nordic: Nordic and Baltic market statistics and index/market data for December 2025. https://view.news.eu.nasdaq.com/view?id=ba92757f16ec4d64735ceb93fecc55231&lang=en&src=rss
London Stock Exchange / LSEG: Trading statistics and market reporting; used for the treatment of Main Market, international issuers and AIM. https://www.lseg.com/en/investor-relations/trading-statistics
AFME: Equity Primary Markets and Trading Report, Q4 2024; cross-check for European equity-market scale. https://www.afme.eu/media/iakbsul1/afmeequityprimarymarketsandtradingreportq42024.pdf
ECMI: Statistical Package 2025; EU, UK, Switzerland and international equity-market comparisons. https://www.ecmi.eu/sites/default/files/ecmi_stat_pack_2025_-_key_findings_final.pdf
European Central Bank: Analysis of EU capital markets and differences between European and US corporate financing. https://www.ecb.europa.eu/press/fie/box/html/ecb.fiebox202406_07.en.html
Method note: The main exchange ranking uses WFE domestic market capitalisation for December 2025. Individual Euronext and Nasdaq market figures use the exchange groups’ own reporting and therefore are shown separately. The regional Europe-US-China comparison uses end-2024 data because it provides a more consistent cross-region basis. Europe is defined there as EU-27 + United Kingdom + Switzerland + Norway + Iceland; transcontinental Russia and Türkiye are not geographically apportioned.
Leave a Reply